How to Use Generative AI for Content Analysis
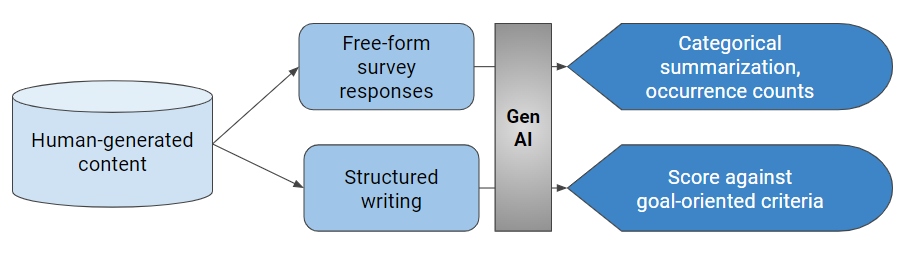
Generative AI has opened up a variety of possibilities for content analysis. The AI engine can take unstructured language, such as free-form text in a survey, and organize it into categories and themes. The AI engine can also take structured writing and score it against goal-oriented criteria. Both processes help content creators and analysts alike […]