Still Not Worth the Cost: A Follow-Up Case Study of Congestion Pricing in the SF Bay Area
Over three years ago, I wrote “Not Worth the Cost: A 17-Month Case Study of Congestion Pricing in the SF Bay Area” as an analysis of congestion pricing on the Express Lane for Highway 237 in Milpitas, CA. I concluded then that the opportunity for saving time was not worth the price of the toll on the Express Lane. Road conditions have changed dramatically since then. Traffic has become so bad that I can now imagine scenarios where paying the price of the toll is worth the savings in aggravation alone. However, one caveat is that at certain points in the commute period, even the Express Lane can become extremely congested, especially during the approach to the Express Lane. Such congestion erodes some of the value proposition of the Express Lane.
For this post, I focus on an update of the data. In a future post, I plan to do some deeper analytics and wax poetic on the poor operations of the Express Lane (for example, cheaters abound with near complete impunity). The bottom-line for the update: commute times are longer, the tolls have shot up, YET the expected drive time for a given toll cost has decreased.
First, here are some general parameters of the data collection:
- Date range: June 18, 2012 to January 24, 2017.
- Time range: 7:28am to 9:53am. The median time was around 9:04am with 50% of the drive times occurring from around 8:41am to 9:20am.
- Total measurements: 160. Nine measurements occurred on days when the Express Lane was not available to toll payers (HOV-only presumably because of capacity problems). I took measurements when I had to drive to work when my schedule did not accommodate taking my vanpool (family schedule, personal appointments, work events, etc…)
- Measuring tool: stopwatch. Note that until the 21st measurement, I used the car clock.
- Measuring points: from the solid white line that identifies the off-ramp from southbound 880 onto 237 to the point where the carpool restriction drops from 10am to 9am (near the Great America Parkway exit).
- Length of drive: 3.2 miles
- Driving rules: stayed in the leftmost non-Express lane.
- Congestion: no observed accidents. I started to observe and experience congestion on the Express lane in late 2013 with the problem worsening over time. In the future, I plan to start measuring this congestion when I am riding in my vanpool.
Below are two charts using the same data. The first chart juxtaposes the time period starting from January, 2012 to the time period starting January, 2014. The trend lines are linear. The second chart compares the time period from June, 2012 to December, 2014 to the time period from January, 2015 to January, 2017. The trend lines there are also linear.

In this view, the red dots signify drives starting from January, 2014. The remaining black dots are drives starting before January, 2014. The trend lines are not very accurate because of the huge range in drive times for a given toll cost (R-squared of 0.47 and 0.50 respectively). For example, when the toll is set at $7, the drive time in the standard lanes can range from 14 to 21 minutes. In other words, the drive can be 50% longer than the best case scenario. At $5, the range goes from 8 to 18 minutes, a truly horrible spread. The spreads do not improve until the lowest toll costs at which point congestion is negligible in the standard lanes. Fortunately, there is just enough clustering to make the data usable. So, for example, from $6.50 to $7.00, I expect the drive to last around 18 minutes in the regular lanes.
The most interesting finding is that since January, 2014, the drive time for a given cost is, on average, below the implied drive time when averaged across the entire date range. This result surprised me. This result technically means that taking the Express Lane makes even less financial sense than before – at least at the lower toll costs say below $4.50 which represented the maximum observed cost from my first analysis. For example, I used to expect a $4 toll to imply a 13 minute drive. Now, I should expect that $4 toll to imply a 12.5 minute drive.
The difference in time periods becomes more stark when I make a clean break between a before and an after period. For this view, I used January, 2015 as the dividing line. Anecdotally, drive times in the regular and carpool lanes began their dramatic increase sometime in 2015.

This chart shows that before January, 2015 a $4 toll implied a near 14-minute drive. Since January, 2015, that same $4 toll implies a near 12-minute drive. The Valley Transportation Authority (VTA) has essentially dropped the price for taking the Express Lane. I am assuming the VTA made this move to increase utilization on the Express Lane. I will need to read the VTA’s financial reports to verify this hypothesis. Note that the VTA can well afford the drop in price because the dramatic increase in commute times gives more people, at the margins, the incentive to hop onto the Express Lane. Presumably, there are also a lot more cars on the road which equate to additional revenue opportunities.
Before January, 2015, the maximum drive time I experienced was 18 minutes ONCE. The next three longest drives were 16 minutes long. Since January, 2015, the maximum drive I experienced was 21 minutes (just this month in fact!). Three other drives were worse than the previous maximum. This worsening in commutes is also reflected in the maximum observed toll which went from $5.50 to $7.00.
I also note that the two trend lines are essentially parallel: the slopes are equal. In other words, the incremental drive time for an incremental increase in toll has remained the same even as the base cost has gone down (think of where the graphs cross the vertical or y-axis when the toll equals $0).
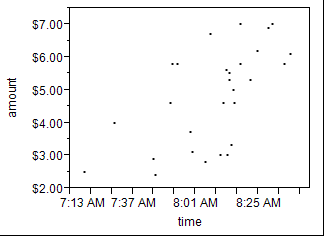
Finally, I include below a chart from a friend of mine who loves the Express Lane and takes it regularly. These data are from recent drives. The chart just confirms an apparent toll maximum at $7 and the slight tendency for tolls to increase later in the morning.
I still do not consider the toll for the Express Lane worth paying except in those dire emergencies where I need to shave any number of minutes from my drive. Such a dire emergency has yet to occur. I am otherwise content just to get extra minutes listening to my latest podcast. The unattractiveness of paying up shows in stark relief when a $6 to $7 toll may save just over 10 minutes. The growing congestion on the Express Lane adds to the baseline uncertainty of the value proposition presented by the toll.
Next up – a deep dive into the VTA’s own analysis.